Welder Salary in Richland, WA: $68,705 (2026)
Quick Answer:A full-time welder in Richland, WA earns a median $68,705/year (≈ $33.03/hour) in nominal terms for 2026 — projected from BLS OEWS 2025 (SOC 51-4121). Once you factor in Richland's price level (7% above national, BEA RPP 107.4), that paycheck buys what $63,971 would nationally. Nominal pay sits 10.4% above the Washington state average.
Based on BLS state-level estimates · View source
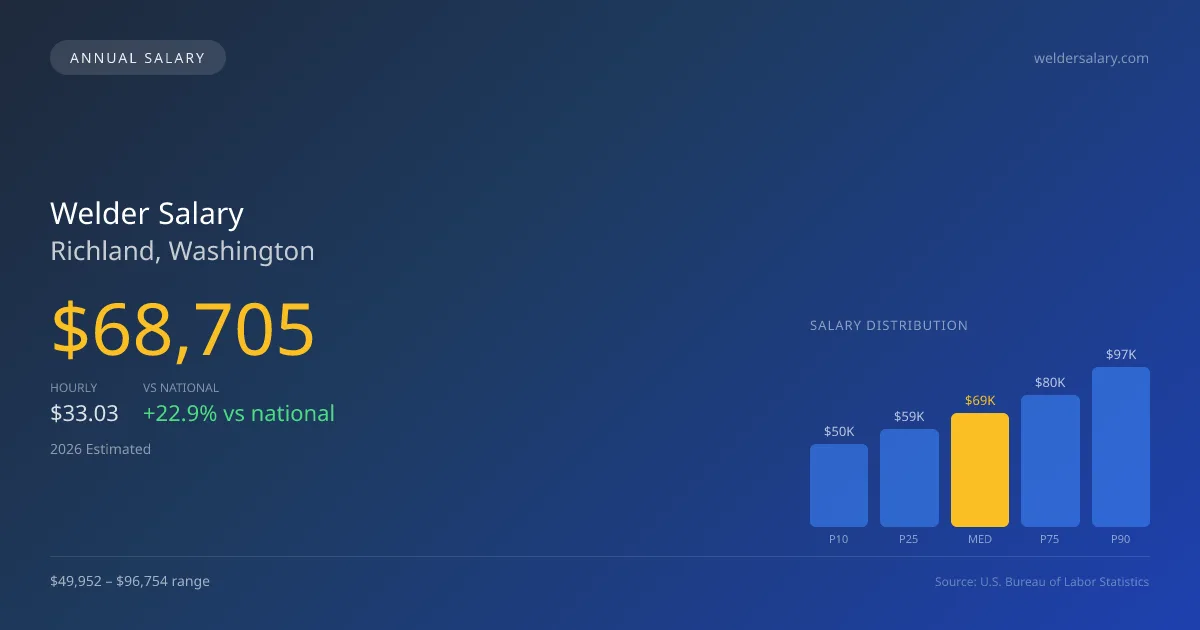
In Richland, WA, the compensation landscape for welders reveals a median annual salary of $68,705, which notably surpasses the national median of $55,895 by approximately 22.92%. The local salary range spans from $49,952 at the 10th percentile to $96,754 at the 90th percentile, indicative of diverse opportunities depending on skill specialization, employer type, and work environment. These figures, derived from 2025 BLS state-level data and regional cost adjustments, reflect a robust economic environment for welders in Richland, particularly when considering that travel-related jobs often provide additional pay incentives. With the local market currently employing about 15 welders, conditions are favorable for skilled laborers seeking competitive salaries.
About the Richland Market
Salary estimated from Washington average ($62,000) adjusted for local cost of living.
Salary Breakdown
| Percentile | Annual | Hourly |
|---|---|---|
| Entry Level (P10) | $49,952 | $24.01 |
| Lower Range (P25) | $59,139 | $28.43 |
| Median (P50)(typical) | $68,705 | $33.03 |
| Upper Range (P75) | $79,648 | $38.29 |
| Top Earners (P90) | $96,754 | $46.51 |
Median Salary Position
22.92% above the national average
2026 Salary Percentile Distribution in Richland
In Richland, WA, the welder salary spread from the 10th to 90th percentile is $46,802 (2026 est.). At $68,705, the local median is 22.92% above the national median of $55,895.
Salary Calculator
At 40 hours/week in Richland: You'd be in the lower-middle range
How Richland Welder Pay Compares
Richland median: $68,705/year (2026)
| Compared To | Median Salary | Richland Pays |
|---|---|---|
| Washington Average | $62,233 | +10.40% more |
| National Average | $55,895 | +22.92% more |
Welders in Richland, WA earn a median of $68,705 per year (2026 est.), which is 22.92% higher than the national median of $55,895 and 10.40% above the Washington state average of $62,233.
Cost-of-Living Adjusted Salary
Richland has a cost of living 7.40% above the national average.
Adjusted salary = nominal × (100 / CoL index). CoL index: 100 = national average.
Richland, WA has a cost-of-living index of 107.4 (above the national average of 100). While the nominal salary of $68,705 is competitive, the higher cost of living reduces purchasing power to an effective $63,971 — a 6.89% reduction.
Compare Purchasing Power
Select a city to see how your salary compares after cost of living
Select a city above to compare purchasing power
2019 BLS Actual
$52,228
2025 BLS Actual
$66,069
2026 Current Est.
$68,705
2019–2027 Growth
+36.8%
Salary Trajectory for Welders in Richland (2019–2027)
2019–2025: actual BLS OEWS data for this metro area. 2026+: CAGR 3.99% projection.
| Year | Annual Salary | Status |
|---|---|---|
| 2019 | $52,228 | Actual |
| 2020 | $54,318 | Actual |
| 2021 | $57,784 | Actual |
| 2022 | $58,436 | Actual |
| 2023 | $60,157 | Actual |
| 2024 | $67,296 | Actual |
| 2025 | $66,069 | Actual |
| 2026(current) | $68,705 | Estimated |
| 2027 | $71,446 | Projected |
Based on 7 years of BLS OEWS data for the Richland metropolitan area, the median welder salary grew 26.5% from $52,228 (2019) to $66,069 (2025). At a 3.99% compound annual growth rate, salaries are projected to reach $71,446 by 2027 — a total increase of $19,218 (36.80%) from 2019.
Note: Historical values (2019–2025) are actual BLS OEWS figures for the Richland metropolitan area, sourced from annual Occupational Employment and Wage Statistics surveys. 2026–2026 figures are current estimates, and 2027 values are projections, calculated using a 3.99% CAGR derived from 7-year BLS historical data. Actual salaries may vary based on employer, experience, certifications, and local market conditions.
Salary by Experience Level
| Experience | Estimated Salary Range |
|---|---|
| 0-2 years (New Graduate) | $49,952 – $59,139 |
| 3-5 years (Mid Career) | $59,139 – $68,705 |
| 5+ years (Experienced) | $68,705 – $79,648 |
| 10+ years (Top Earner) | $79,648 – $96,754 |
WLD salary ranges estimated from BLS percentile data. Individual welder compensation varies by employer, certifications, and specialization.
Welder Job Market in Richland
As you examine the local job market strength, the cost of living index stands at 107.4, hinting that take-home purchasing power needs careful consideration for welders in Richland. Higher-paying employers in this sector include structural steel fabrication shops and those involved in oil and gas pipeline welding, as well as petrochemical turnarounds where specialty skills can significantly influence earnings. The gap in pay often results from factors such as certification levels; for instance, 6G pipe certified welders typically earn higher wages than their structural counterparts. Additionally, traveling work with per-diem benefits can raise base pay by 30-50%, while ownership of welding rigs represents a substantial investment that can impact earning potential. To maximize pay in Richland, welders should focus on attaining advanced certifications, seeking positions in high-demand sectors, and considering travel work options, all of which will enhance compensation in this competitive landscape.
More salary data for Richland, WA:
Frequently Asked Questions
How much do welders make in Richland, WA in 2026?
Is Richland, WA a good place to work as a welder?
Can welders make $100K in Richland?
What is the cost-of-living adjusted welder salary in Richland?
How much does a welder make per hour in Richland?
Related Pages
Compare Salaries
Career Resources
Nearby Cities in Washington
Written by James Mendoza, AWS Certified Welder
Career Analyst
James has over 10 years of experience in welding. He specializes in MIG and TIG welding. He has worked in various manufacturing settings.
Methodology & Data Source
Salary figures on this page are 2026 projections based on the Bureau of Labor Statistics Occupational Employment and Wage Statistics (OEWS) survey, May 2026 release. The BLS reported a median annual salary of $66,069 for weldersin the Richland metropolitan area. A 3.99% compound annual growth rate (CAGR), calculated from 6-year national BLS wage trends, was applied to project current 2026 compensation. Percentile ranges (P10–P90) represent the full salary distribution across experience levels and practice settings in this market.
Data Sources & Methodology
Salary data for Richland is estimated from official BLS state-level occupational wage data (2025), adjusted for regional cost-of-living differences using BEA RPP (Regional Price Parities).
2026 figures are projected from 2025 BLS data using a compound annual growth rate (CAGR) of 3.99%, derived from historical BLS wage trends for welders (SOC 51-4121).
Compiled and verified by James Mendoza, AWS Certified Welder, a licensed welder with 10+ years of clinical experience. · View source data at BLS.gov