Welder Salary in Kirkland, WA: $62,037 (2026)
Quick Answer:A full-time welder in Kirkland, WA earns a median $62,037/year (≈ $29.82/hour) in nominal terms for 2026 — projected from BLS OEWS 2025 (SOC 51-4121). Once you factor in Kirkland's price level (7% above national, BEA RPP 107.4), that paycheck buys what $57,763 would nationally. Nominal pay sits 0.3% below the Washington state average.
Based on BLS state-level estimates · View source
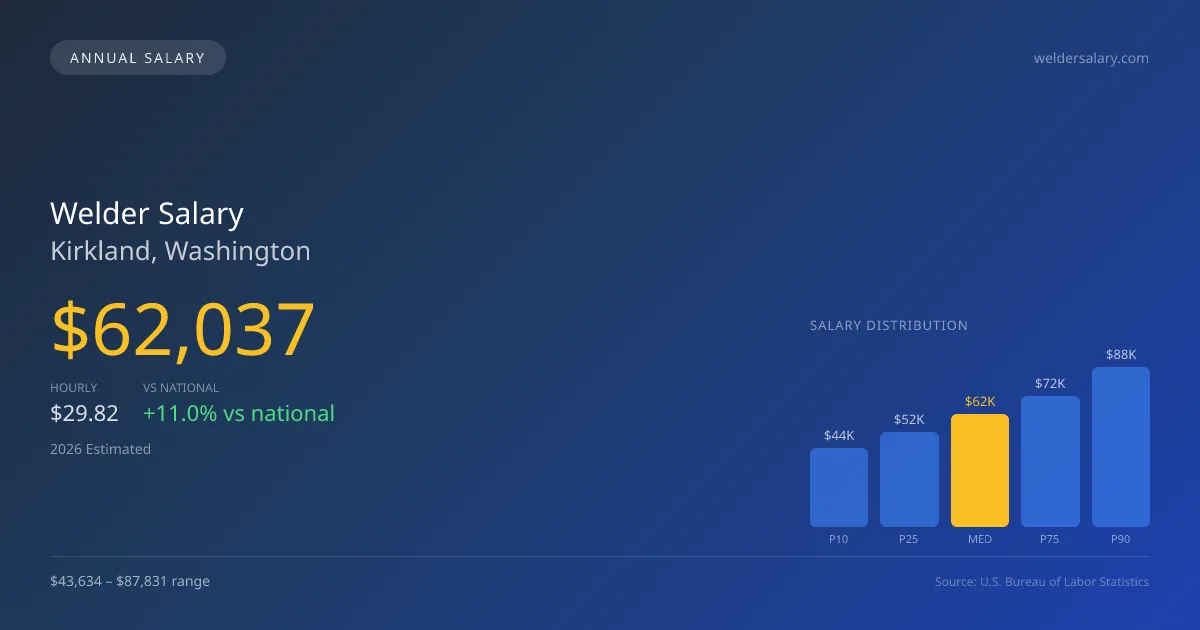
In 2026, the projected welder salary in Kirkland, Washington, stands at an impressive $62,037 per year, surpassing the national average of $55,895 by a significant margin of 10.99%. This reflects the local labor market's robust demand, particularly for pipe welders and other specialists who often command higher rates due to specific certifications and skills. The salary range for welders in this region is quite broad, with the lowest 10% earning approximately $43,634, while top earners can make as much as $87,831 annually. These figures are based on estimates derived from 2025 BLS data, adjusted for local economic conditions. The presence of various welding sectors in Kirkland suggests a wealth of opportunities, prompting those with relevant certifications to capitalize on the competitive pay.
About the Kirkland Market
Salary estimated from Washington average ($62,000) adjusted for local cost of living.
Salary Breakdown
| Percentile | Annual | Hourly |
|---|---|---|
| Entry Level (P10) | $43,634 | $20.97 |
| Lower Range (P25) | $52,345 | $25.17 |
| Median (P50)(typical) | $62,037 | $29.82 |
| Upper Range (P75) | $72,150 | $34.69 |
| Top Earners (P90) | $87,831 | $42.23 |
Median Salary Position
10.99% above the national average
2026 Salary Percentile Distribution in Kirkland
In Kirkland, WA, the welder salary spread from the 10th to 90th percentile is $44,197 (2026 est.). At $62,037, the local median is 10.99% above the national median of $55,895.
Salary Calculator
At 40 hours/week in Kirkland: You'd be in the lower-middle range
How Kirkland Welder Pay Compares
Kirkland median: $62,037/year (2026)
| Compared To | Median Salary | Kirkland Pays |
|---|---|---|
| Washington Average | $62,224 | -0.30% less |
| National Average | $55,895 | +10.99% more |
Welders in Kirkland, WA earn a median of $62,037 per year (2026 est.), which is 10.99% higher than the national median of $55,895 and 0.30% below the Washington state average of $62,224.
Cost-of-Living Adjusted Salary
Kirkland has a cost of living 7.40% above the national average.
Adjusted salary = nominal × (100 / CoL index). CoL index: 100 = national average.
Kirkland, WA has a cost-of-living index of 107.4 (above the national average of 100). While the nominal salary of $62,037 is competitive, the higher cost of living reduces purchasing power to an effective $57,763 — a 6.89% reduction.
Compare Purchasing Power
Select a city to see how your salary compares after cost of living
Select a city above to compare purchasing power
2019 BLS Actual
$47,160
2025 BLS Actual
$59,657
2026 Current Est.
$62,037
2019–2027 Growth
+36.8%
Salary Trajectory for Welders in Kirkland (2019–2027)
2019–2025: actual BLS OEWS data for this metro area. 2026+: CAGR 3.99% projection.
| Year | Annual Salary | Status |
|---|---|---|
| 2019 | $47,160 | Actual |
| 2020 | $49,046 | Actual |
| 2021 | $52,176 | Actual |
| 2022 | $52,765 | Actual |
| 2023 | $54,318 | Actual |
| 2024 | $66,362 | Actual |
| 2025 | $59,657 | Actual |
| 2026(current) | $62,037 | Estimated |
| 2027 | $64,513 | Projected |
Based on 7 years of BLS OEWS data for the Kirkland metropolitan area, the median welder salary grew 26.5% from $47,160 (2019) to $59,657 (2025). At a 3.99% compound annual growth rate, salaries are projected to reach $64,513 by 2027 — a total increase of $17,353 (36.80%) from 2019.
Note: Historical values (2019–2025) are actual BLS OEWS figures for the Kirkland metropolitan area, sourced from annual Occupational Employment and Wage Statistics surveys. 2026–2026 figures are current estimates, and 2027 values are projections, calculated using a 3.99% CAGR derived from 7-year BLS historical data. Actual salaries may vary based on employer, experience, certifications, and local market conditions.
Salary by Experience Level
| Experience | Estimated Salary Range |
|---|---|
| 0-2 years (New Graduate) | $43,634 – $52,345 |
| 3-5 years (Mid Career) | $52,345 – $62,037 |
| 5+ years (Experienced) | $62,037 – $72,150 |
| 10+ years (Top Earner) | $72,150 – $87,831 |
WLD salary ranges estimated from BLS percentile data. Individual welder compensation varies by employer, certifications, and specialization.
Welder Job Market in Kirkland
The local job market for welders remains relatively tight, with only 13 welders currently employed in Kirkland, adding to a sense of exclusivity in the profession. The cost of living index in the area is 107.4, slightly above the national average, which influences take-home pay and purchasing power for welders. Among local employers, structural steel fabrication shops, oil and gas firms, and aerospace manufacturers typically provide the highest wages, driven by project demands and the skill sets required. Key factors contributing to the pay disparity include certification levels, with 6G pipe certification attracting higher salaries, traveling positions that may offer significant per-diem compensation, and specialty fields like nuclear or underwater welding that come with unique risks and rewards. To maximize financial returns in Kirkland's welding market, welders should focus on obtaining advanced certifications and considering opportunities that involve travel or specialized skills, as these avenues can dramatically elevate overall earnings.
More salary data for Kirkland, WA:
Frequently Asked Questions
How much do welders make in Kirkland, WA in 2026?
Is Kirkland, WA a good place to work as a welder?
Can welders make $100K in Kirkland?
What is the cost-of-living adjusted welder salary in Kirkland?
How much does a welder make per hour in Kirkland?
Related Pages
Compare Salaries
Career Resources
Nearby Cities in Washington
Written by James Mendoza, AWS Certified Welder
Career Analyst
James has over 10 years of experience in welding. He specializes in MIG and TIG welding. He has worked in various manufacturing settings.
Methodology & Data Source
Salary figures on this page are 2026 projections based on the Bureau of Labor Statistics Occupational Employment and Wage Statistics (OEWS) survey, May 2026 release. The BLS reported a median annual salary of $59,657 for weldersin the Kirkland metropolitan area. A 3.99% compound annual growth rate (CAGR), calculated from 6-year national BLS wage trends, was applied to project current 2026 compensation. Percentile ranges (P10–P90) represent the full salary distribution across experience levels and practice settings in this market.
Data Sources & Methodology
Salary data for Kirkland is estimated from official BLS state-level occupational wage data (2025), adjusted for regional cost-of-living differences using BEA RPP (Regional Price Parities).
2026 figures are projected from 2025 BLS data using a compound annual growth rate (CAGR) of 3.99%, derived from historical BLS wage trends for welders (SOC 51-4121).
Compiled and verified by James Mendoza, AWS Certified Welder, a licensed welder with 10+ years of clinical experience. · View source data at BLS.gov