Welder Salary in Barre, VT: $54,617 (2026)
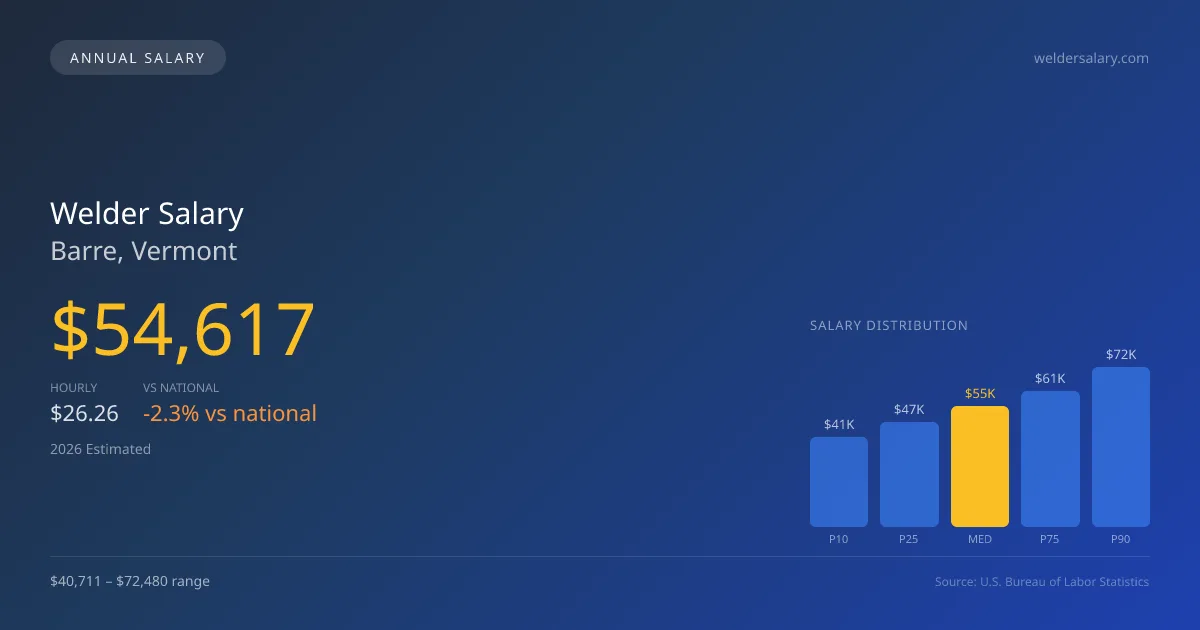
Quick Answer:A full-time welder in Barre, VT earns a median $54,617/year (≈ $26.26/hour) in nominal terms for 2026 — projected from BLS OEWS 2025 (SOC 51-4121). Once you factor in Barre's price level (4% above national, BEA RPP 103.5), that paycheck buys what $52,770 would nationally. Nominal pay sits 5.6% below the Vermont state average.
Based on BLS state-level estimates · View source
In Barre, Vermont, the economic landscape for welders is shaped significantly by the presence of traveling pipe welders, who often receive enhanced compensation through per-diem payments and a tax-advantaged structure for their work. The median annual salary for welders in Barre is projected at $54,617 for 2026, reflecting local trends that show an annual range between $40,711 at the 10th percentile and reaching up to $72,480 at the 90th percentile. These figures, derived from state-level data and adjusted for regional price parities, suggest that local shop pay may not compete as effectively with the offerings for those in traveling roles. Given the dynamics between local and traveling opportunities, the Barre job market for welders poses distinct advantages and challenges, influencing the overall appeal of pursuing a career in this field.
About the Barre Market
Salary estimated from Vermont average ($54,000) adjusted for local cost of living.
Salary Breakdown
| Percentile | Annual | Hourly |
|---|---|---|
| Entry Level (P10) | $40,711 | $19.57 |
| Lower Range (P25) | $47,376 | $22.77 |
| Median (P50)(typical) | $54,617 | $26.26 |
| Upper Range (P75) | $61,499 | $29.56 |
| Top Earners (P90) | $72,480 | $34.85 |
Median Salary Position
2.29% below the national average
2026 Salary Percentile Distribution in Barre
In Barre, VT, the welder salary spread from the 10th to 90th percentile is $31,769 (2026 est.). At $54,617, the local median is 2.29% below the national median of $55,895.
Salary Calculator
At 40 hours/week in Barre: You'd be in the lower-middle range
How Barre Welder Pay Compares
Barre median: $54,617/year (2026)
| Compared To | Median Salary | Barre Pays |
|---|---|---|
| Vermont Average | $57,857 | -5.60% less |
| National Average | $55,895 | -2.29% less |
Welders in Barre, VT earn a median of $54,617 per year (2026 est.), which is 2.29% lower than the national median of $55,895 and 5.60% below the Vermont state average of $57,857.
Cost-of-Living Adjusted Salary
Barre has a cost of living 3.50% above the national average.
Adjusted salary = nominal × (100 / CoL index). CoL index: 100 = national average.
Barre, VT has a cost-of-living index of 103.5 (above the national average of 100). While the nominal salary of $54,617 is competitive, the higher cost of living reduces purchasing power to an effective $52,770 — a 3.38% reduction.
Compare Purchasing Power
Select a city to see how your salary compares after cost of living
Select a city above to compare purchasing power
2019 BLS Actual
$41,518
2025 BLS Actual
$52,521
2026 Current Est.
$54,617
2019–2027 Growth
+36.8%
Salary Trajectory for Welders in Barre (2019–2027)
2019–2025: actual BLS OEWS data for this metro area. 2026+: CAGR 3.99% projection.
| Year | Annual Salary | Status |
|---|---|---|
| 2019 | $41,518 | Actual |
| 2020 | $43,180 | Actual |
| 2021 | $45,935 | Actual |
| 2022 | $46,453 | Actual |
| 2023 | $47,821 | Actual |
| 2024 | $52,766 | Actual |
| 2025 | $52,521 | Actual |
| 2026(current) | $54,617 | Estimated |
| 2027 | $56,796 | Projected |
Based on 7 years of BLS OEWS data for the Barre metropolitan area, the median welder salary grew 26.5% from $41,518 (2019) to $52,521 (2025). At a 3.99% compound annual growth rate, salaries are projected to reach $56,796 by 2027 — a total increase of $15,278 (36.80%) from 2019.
Note: Historical values (2019–2025) are actual BLS OEWS figures for the Barre metropolitan area, sourced from annual Occupational Employment and Wage Statistics surveys. 2026–2026 figures are current estimates, and 2027 values are projections, calculated using a 3.99% CAGR derived from 7-year BLS historical data. Actual salaries may vary based on employer, experience, certifications, and local market conditions.
Salary by Experience Level
| Experience | Estimated Salary Range |
|---|---|
| 0-2 years (New Graduate) | $40,711 – $47,376 |
| 3-5 years (Mid Career) | $47,376 – $54,617 |
| 5+ years (Experienced) | $54,617 – $61,499 |
| 10+ years (Top Earner) | $61,499 – $72,480 |
WLD salary ranges estimated from BLS percentile data. Individual welder compensation varies by employer, certifications, and specialization.
Welder Job Market in Barre
The local job market in Barre employs only about six welders, but the relatively high cost of living, with a cost-of-living index of 103.5, impacts the effective purchasing power of salaries earned. Employers in specialized fields, such as structural steel fabrication and the oil and gas pipeline sectors, tend to offer the most competitive wages. Top earners often possess advanced certifications like the 6G pipe qualification or specialties in nuclear power plant maintenance, which can drive salaries significantly higher. The wage spread can also be attributed to the varying demands for specific skill sets, with traveling welders benefitting from high per-diem structures, while those in local positions may not receive similar incentives. For welders in Barre seeking to maximize their pay, pursuing certifications, especially in high-demand specialties and considering transition to traveling roles, presents the most viable path forward in this evolving market.
More salary data for Barre, VT:
Frequently Asked Questions
How much do welders make in Barre, VT in 2026?
Is Barre, VT a good place to work as a welder?
Can welders make $100K in Barre?
What is the cost-of-living adjusted welder salary in Barre?
How much does a welder make per hour in Barre?
Related Pages
Compare Salaries
Career Resources
Nearby Cities in Vermont
Written by James Mendoza, AWS Certified Welder
Career Analyst
James has over 10 years of experience in welding. He specializes in MIG and TIG welding. He has worked in various manufacturing settings.
Methodology & Data Source
Salary figures on this page are 2026 projections based on the Bureau of Labor Statistics Occupational Employment and Wage Statistics (OEWS) survey, May 2026 release. The BLS reported a median annual salary of $52,521 for weldersin the Barre metropolitan area. A 3.99% compound annual growth rate (CAGR), calculated from 6-year national BLS wage trends, was applied to project current 2026 compensation. Percentile ranges (P10–P90) represent the full salary distribution across experience levels and practice settings in this market.
Data Sources & Methodology
Salary data for Barre is estimated from official BLS state-level occupational wage data (2025), adjusted for regional cost-of-living differences using BEA RPP (Regional Price Parities).
2026 figures are projected from 2025 BLS data using a compound annual growth rate (CAGR) of 3.99%, derived from historical BLS wage trends for welders (SOC 51-4121).
Compiled and verified by James Mendoza, AWS Certified Welder, a licensed welder with 10+ years of clinical experience. · View source data at BLS.gov