Welder Salary in Salem, OR: $59,461 (2026)
Quick Answer:A full-time welder in Salem, OR earns a median $59,461/year (≈ $28.59/hour) in nominal terms for 2026 — projected from BLS OEWS 2025 (SOC 51-4121). Once you factor in Salem's price level (4% above national, BEA RPP 103.6), that paycheck buys what $57,368 would nationally. Nominal pay sits 0.2% above the Oregon state average.
Official BLS data · View source
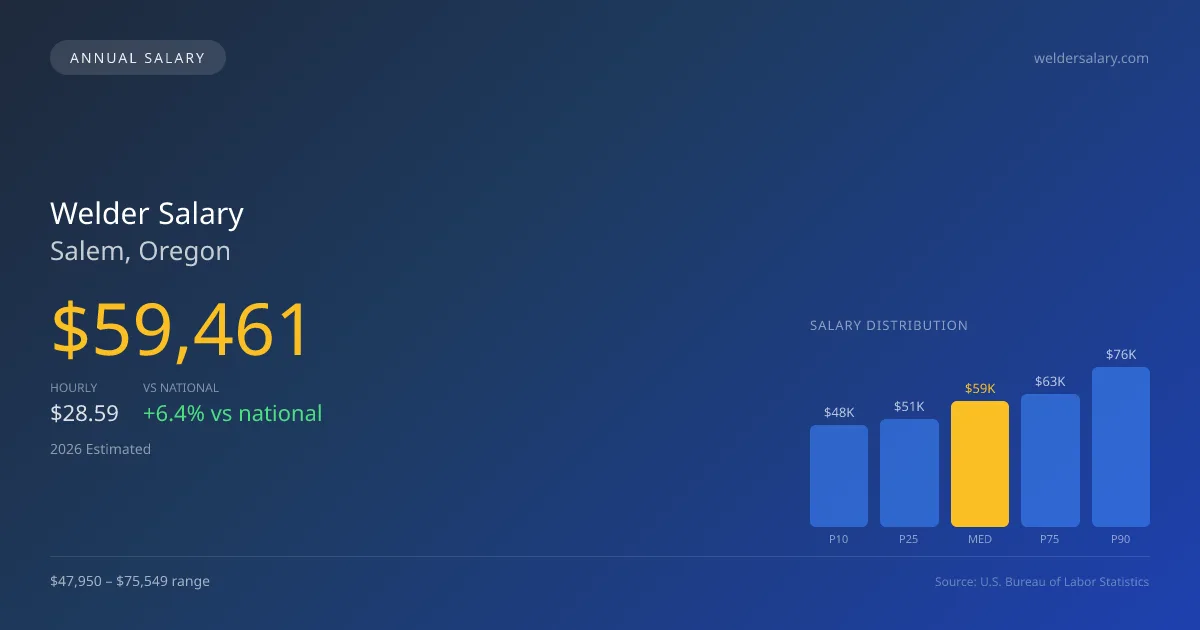
In 2026, welders in Salem, OR, can expect a median annual salary of $59,461, which exceeds the national average by roughly 6.38%. With a salary range from $47,950 at the 10th percentile to $75,549 at the 90th percentile, these figures reflect a stable job market bolstered by the local economy. This data is derived from official Bureau of Labor Statistics OEWS surveys, indicating favorable conditions for experienced welders. Given Salem's demand for skilled professionals and various employment opportunities across industries, there is potential for welders to make a significant return on their investment, particularly for those considering ownership of their welding rig.
Salary Breakdown
| Percentile | Annual | Hourly |
|---|---|---|
| Entry Level (P10) | $47,950 | $23.05 |
| Lower Range (P25) | $50,830 | $24.44 |
| Median (P50)(typical) | $59,461 | $28.59 |
| Upper Range (P75) | $62,956 | $30.27 |
| Top Earners (P90) | $75,549 | $36.32 |
Median Salary Position
6.38% above the national average
2026 Salary Percentile Distribution in Salem
In Salem, OR, the welder salary spread from the 10th to 90th percentile is $27,599 (2026 est.). At $59,461, the local median is 6.38% above the national median of $55,895.
Salary Calculator
At 40 hours/week in Salem: You'd be in the lower-middle range
How Salem Welder Pay Compares
Salem median: $59,461/year (2026)
| Compared To | Median Salary | Salem Pays |
|---|---|---|
| Oregon Average | $59,343 | +0.20% more |
| National Average | $55,895 | +6.38% more |
Welders in Salem, OR earn a median of $59,461 per year (2026 est.), which is 6.38% higher than the national median of $55,895 and 0.20% above the Oregon state average of $59,343.
Cost-of-Living Adjusted Salary
Salem has a cost of living 3.65% above the national average.
Adjusted salary = nominal × (100 / CoL index). CoL index: 100 = national average.
Salem, OR has a cost-of-living index of 103.649 (above the national average of 100). While the nominal salary of $59,461 is competitive, the higher cost of living reduces purchasing power to an effective $57,368 — a 3.52% reduction.
Compare Purchasing Power
Select a city to see how your salary compares after cost of living
Select a city above to compare purchasing power
2019 BLS Actual
$47,630
2025 BLS Actual
$57,180
2026 Current Est.
$59,461
2019–2027 Growth
+29.8%
Salary Trajectory for Welders in Salem (2019–2027)
2019–2025: actual BLS OEWS data for this metro area. 2026+: CAGR 3.99% projection.
| Year | Annual Salary | Status |
|---|---|---|
| 2019 | $47,630 | Actual |
| 2020 | $46,380 | Actual |
| 2021 | $46,620 | Actual |
| 2022 | $46,450 | Actual |
| 2023 | $49,390 | Actual |
| 2024 | $52,520 | Actual |
| 2025 | $57,180 | Actual |
| 2026(current) | $59,461 | Estimated |
| 2027 | $61,834 | Projected |
Based on 7 years of BLS OEWS data for the Salem metropolitan area, the median welder salary grew 20.1% from $47,630 (2019) to $57,180 (2025). At a 3.99% compound annual growth rate, salaries are projected to reach $61,834 by 2027 — a total increase of $14,204 (29.82%) from 2019.
Note: Historical values (2019–2025) are actual BLS OEWS figures for the Salem metropolitan area, sourced from annual Occupational Employment and Wage Statistics surveys. 2026–2026 figures are current estimates, and 2027 values are projections, calculated using a 3.99% CAGR derived from 7-year BLS historical data. Actual salaries may vary based on employer, experience, certifications, and local market conditions.
Salary by Experience Level
| Experience | Estimated Salary Range |
|---|---|
| 0-2 years (New Graduate) | $47,950 – $50,830 |
| 3-5 years (Mid Career) | $50,830 – $59,461 |
| 5+ years (Experienced) | $59,461 – $62,956 |
| 10+ years (Top Earner) | $62,956 – $75,549 |
WLD salary ranges estimated from BLS percentile data. Individual welder compensation varies by employer, certifications, and specialization.
Welder Job Market in Salem
The job market in Salem is robust, with approximately 410 welders currently employed in the area. However, the cost of living index of 103.649 suggests that professionals must strategically consider their compensation relative to expenses. Employers in structural steel fabrication, oil and gas pipeline welding, and aerospace sectors typically offer the highest salaries. Factors influencing the wage differential include the level of certification, with specialties such as underwater welding and nuclear maintenance commanding premiums, as well as the distinction between local and traveling work—traveling welders often enjoy per diem incentives. For welders in Salem, pursuing advanced certifications like the 6G pipe weld or NQA-1 can enhance earning potential, along with staying adaptable to boom-bust cycles in the oil and gas market, ensuring strong take-home pay in this competitive field.
More salary data for Salem, OR:
Frequently Asked Questions
How much do welders make in Salem, OR in 2026?
Is Salem, OR a good place to work as a welder?
Can welders make $100K in Salem?
What is the cost-of-living adjusted welder salary in Salem?
How much does a welder make per hour in Salem?
Related Pages
Compare Salaries
Career Resources
Nearby Cities in Oregon
Written by James Mendoza, AWS Certified Welder
Career Analyst
James has over 10 years of experience in welding. He specializes in MIG and TIG welding. He has worked in various manufacturing settings.
Methodology & Data Source
Salary figures on this page are 2026 projections based on the Bureau of Labor Statistics Occupational Employment and Wage Statistics (OEWS) survey, May 2026 release. The BLS reported a median annual salary of $57,180 for weldersin the Salem metropolitan area. A 3.99% compound annual growth rate (CAGR), calculated from 6-year national BLS wage trends, was applied to project current 2026 compensation. Percentile ranges (P10–P90) represent the full salary distribution across experience levels and practice settings in this market.
Data Sources & Methodology
Source: BLS, OEWS, 7-year dataset (–). Per-city data from annual BLS metropolitan area surveys.
2026 figures are projected from 2025 BLS data using a compound annual growth rate (CAGR) of 3.99%, derived from historical BLS wage trends for welders (SOC 51-4121).
Compiled and verified by James Mendoza, AWS Certified Welder, a licensed welder with 10+ years of clinical experience. · View source data at BLS.gov