Welder Salary in Norfolk, NE: $47,631 (2026)
Quick Answer:A full-time welder in Norfolk, NE earns a median $47,631/year (≈ $22.90/hour) in nominal terms for 2026 — projected from BLS OEWS 2025 (SOC 51-4121). Once you factor in Norfolk's price level (8% below national, BEA RPP 91.5), that paycheck buys what $52,056 would nationally. Nominal pay sits 6.9% below the Nebraska state average.
Based on BLS state-level estimates · View source
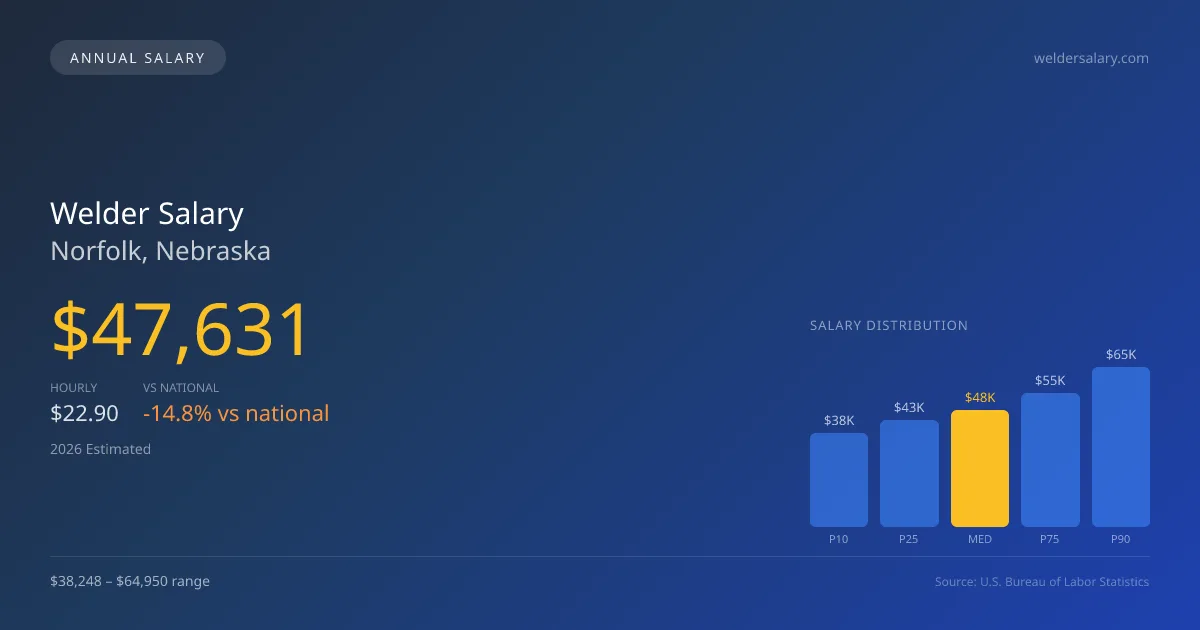
In Norfolk, NE, the welder salary averages around $47,631 in 2026, reflecting a comparative underperformance versus the national median of $55,895. Local salaries span from $38,248 at the lowest decile to $64,950 for top earners, illustrating a broad pay spectrum influenced largely by specialization and experience level. This market predominantly favors pipe welding roles, which tend to offer higher compensation due to skill demands in the field, particularly with advanced qualifications such as 6G certification. As the welding sector continues to evolve, particularly in specialized applications, it's significant to observe how these trends will shape job opportunities in Norfolk's labor market.
About the Norfolk Market
Salary estimated from Nebraska average ($50,000) adjusted for local cost of living.
Salary Breakdown
| Percentile | Annual | Hourly |
|---|---|---|
| Entry Level (P10) | $38,248 | $18.39 |
| Lower Range (P25) | $43,462 | $20.89 |
| Median (P50)(typical) | $47,631 | $22.90 |
| Upper Range (P75) | $54,568 | $26.24 |
| Top Earners (P90) | $64,950 | $31.23 |
Median Salary Position
14.78% below the national average
2026 Salary Percentile Distribution in Norfolk
In Norfolk, NE, the welder salary spread from the 10th to 90th percentile is $26,702 (2026 est.). At $47,631, the local median is 14.78% below the national median of $55,895.
Salary Calculator
At 40 hours/week in Norfolk: You'd be in the lower-middle range
How Norfolk Welder Pay Compares
Norfolk median: $47,631/year (2026)
| Compared To | Median Salary | Norfolk Pays |
|---|---|---|
| Nebraska Average | $51,161 | -6.90% less |
| National Average | $55,895 | -14.78% less |
Welders in Norfolk, NE earn a median of $47,631 per year (2026 est.), which is 14.78% lower than the national median of $55,895 and 6.90% below the Nebraska state average of $51,161.
Cost-of-Living Adjusted Salary
Norfolk has a cost of living 8.50% below the national average, meaning your salary goes further here.
Adjusted salary = nominal × (100 / CoL index). CoL index: 100 = national average.
Norfolk, NE has a cost-of-living index of 91.5 (below the national average of 100). A welder earning $47,631 nominally has purchasing power equivalent to $52,056 in an average-cost city — an effective 9.29% boost.
Compare Purchasing Power
Select a city to see how your salary compares after cost of living
Select a city above to compare purchasing power
2019 BLS Actual
$36,208
2025 BLS Actual
$45,803
2026 Current Est.
$47,631
2019–2027 Growth
+36.8%
Salary Trajectory for Welders in Norfolk (2019–2027)
2019–2025: actual BLS OEWS data for this metro area. 2026+: CAGR 3.99% projection.
| Year | Annual Salary | Status |
|---|---|---|
| 2019 | $36,208 | Actual |
| 2020 | $37,656 | Actual |
| 2021 | $40,060 | Actual |
| 2022 | $40,511 | Actual |
| 2023 | $41,704 | Actual |
| 2024 | $42,608 | Actual |
| 2025 | $45,803 | Actual |
| 2026(current) | $47,631 | Estimated |
| 2027 | $49,531 | Projected |
Based on 7 years of BLS OEWS data for the Norfolk metropolitan area, the median welder salary grew 26.5% from $36,208 (2019) to $45,803 (2025). At a 3.99% compound annual growth rate, salaries are projected to reach $49,531 by 2027 — a total increase of $13,323 (36.80%) from 2019.
Note: Historical values (2019–2025) are actual BLS OEWS figures for the Norfolk metropolitan area, sourced from annual Occupational Employment and Wage Statistics surveys. 2026–2026 figures are current estimates, and 2027 values are projections, calculated using a 3.99% CAGR derived from 7-year BLS historical data. Actual salaries may vary based on employer, experience, certifications, and local market conditions.
Salary by Experience Level
| Experience | Estimated Salary Range |
|---|---|
| 0-2 years (New Graduate) | $38,248 – $43,462 |
| 3-5 years (Mid Career) | $43,462 – $47,631 |
| 5+ years (Experienced) | $47,631 – $54,568 |
| 10+ years (Top Earner) | $54,568 – $64,950 |
WLD salary ranges estimated from BLS percentile data. Individual welder compensation varies by employer, certifications, and specialization.
Welder Job Market in Norfolk
Within the local job landscape, only 6 welders are currently employed, hinting at potential for growth in this sector considering the region's cost of living index of 91.5, which suggests favorable conditions for take-home pay. Employers specializing in oil and gas pipeline projects often provide the highest wages, alongside work in structural steel fabrication. However, certifications such as ASME IX and specialized skills in areas like nuclear welding can create considerable pay distinctions. Factors such as traveling status and rig ownership introduce complexity into income variations, with per-diem options for travel work significantly boosting earnings. To maximize pay, focus on securing advanced certifications and consider diversifying skills across multiple welding types, positioning yourself to capture opportunities as demand continues to surge in the region.
More salary data for Norfolk, NE:
Frequently Asked Questions
How much do welders make in Norfolk, NE in 2026?
Is Norfolk, NE a good place to work as a welder?
Can welders make $100K in Norfolk?
What is the cost-of-living adjusted welder salary in Norfolk?
How much does a welder make per hour in Norfolk?
Related Pages
Compare Salaries
Career Resources
Nearby Cities in Nebraska
Written by James Mendoza, AWS Certified Welder
Career Analyst
James has over 10 years of experience in welding. He specializes in MIG and TIG welding. He has worked in various manufacturing settings.
Methodology & Data Source
Salary figures on this page are 2026 projections based on the Bureau of Labor Statistics Occupational Employment and Wage Statistics (OEWS) survey, May 2026 release. The BLS reported a median annual salary of $45,803 for weldersin the Norfolk metropolitan area. A 3.99% compound annual growth rate (CAGR), calculated from 6-year national BLS wage trends, was applied to project current 2026 compensation. Percentile ranges (P10–P90) represent the full salary distribution across experience levels and practice settings in this market.
Data Sources & Methodology
Salary data for Norfolk is estimated from official BLS state-level occupational wage data (2025), adjusted for regional cost-of-living differences using BEA RPP (Regional Price Parities).
2026 figures are projected from 2025 BLS data using a compound annual growth rate (CAGR) of 3.99%, derived from historical BLS wage trends for welders (SOC 51-4121).
Compiled and verified by James Mendoza, AWS Certified Welder, a licensed welder with 10+ years of clinical experience. · View source data at BLS.gov