Welder Salary in Massachusetts: $64,349 (2026)
Quick Answer:Across Massachusetts's 57 metropolitan areas, the average median welder pay sits at $64,349/year heading into 2026 — a figure projected from 2025 BLS OEWS wage data for SOC 51-4121. Because Massachusetts sits at BEA RPP 108.5 (9% above the U.S. baseline), that statewide median translates to roughly $59,308 in nationally-comparable purchasing power. Highest-paying metros: Boston ($63,770), Newton ($63,257), Cambridge ($62,247).
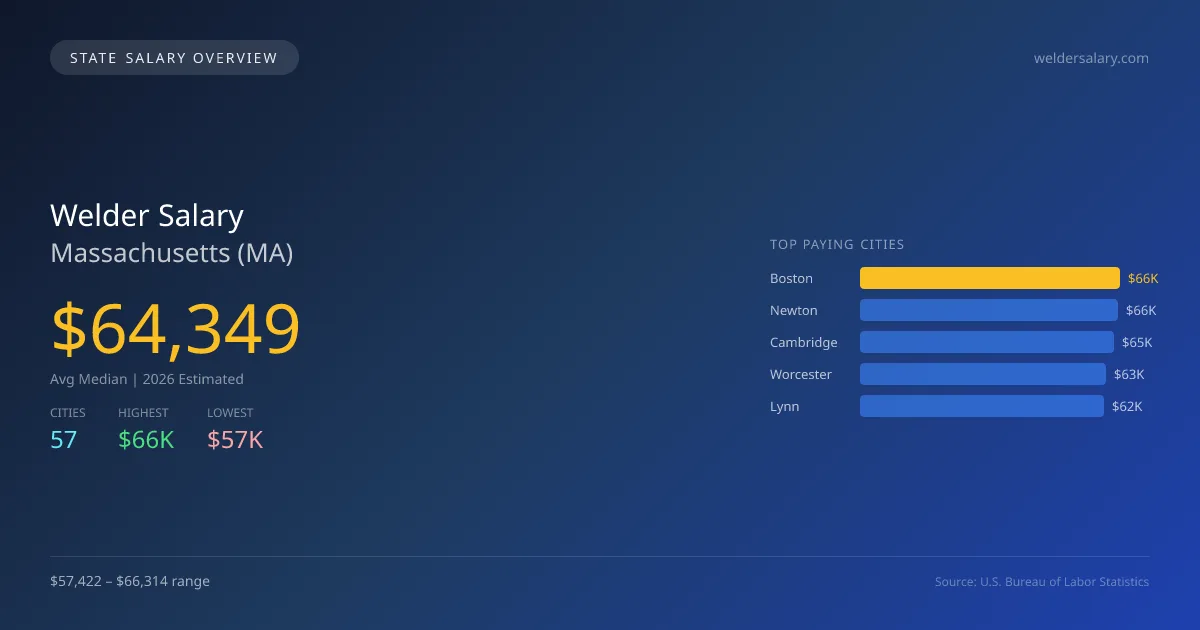
The average median salary for welders in Massachusetts is projected to be $64,349 in 2026, which is 15.1% higher than the national median of $55,895. The salary range varies significantly across cities; for instance, welders in Boston can expect to earn approximately $66,314, while those in Andover are projected to make around $57,422. This $8,892 difference can be attributed to factors such as the cost of living, demand for skilled labor, and the concentration of industries in urban areas like Boston. Massachusetts has specific licensing requirements and scope of practice laws that can influence earnings potential, highlighting the importance of certification and expertise in specialized welding techniques. The job market for welders is expected to maintain a healthy growth rate of 3.99%, reflecting ongoing demand driven by construction, manufacturing, and the renewable energy sector. With a total of 3,357 welders employed in the state, the top five cities for projected earnings in 2026 are Boston ($66,314), Newton ($65,781), Cambridge ($64,731), Worcester ($62,727), and Lynn ($62,289). The consistent demand for skilled welders, coupled with the state's competitive salaries, suggests a positive outlook for those entering the profession in Massachusetts.
Massachusetts Welder Salary Range
Overall salary range in Massachusetts: $41,465 (lowest entry-level) to $95,583 (highest top earner)
Massachusetts vs National Average
Massachusetts welders earn 15.12% more than the national median (+$8,454/year difference).
Massachusetts Welder Salary Distribution (2026)
Welder salaries in Massachusetts range from $49,090 (entry-level, 10th percentile) to $85,766 (top earners, 90th percentile), with a median of $64,349. The Massachusetts median is $8,454 above the US national median of $55,895. The average hourly rate is $30.94/hr. Approximately 3,357 welders are employed across 57 cities.
2019 BLS Actual
$51,845
2025 BLS Actual
$61,880
2026 Current Est.
$64,349
2019–2027 Growth
+29.1%
Salary Trajectory for Welders in Massachusetts (2019–2027)
2019–2025: actual BLS OEWS data for this metro area. 2026+: CAGR 3.99% projection.
| Year | Annual Salary | Status |
|---|---|---|
| 2019 | $51,845 | Actual |
| 2020 | $51,552 | Actual |
| 2021 | $49,725 | Actual |
| 2022 | $54,424 | Actual |
| 2023 | $58,159 | Actual |
| 2024 | $62,713 | Actual |
| 2025 | $61,880 | Actual |
| 2026(current) | $64,349 | Estimated |
| 2027 | $66,916 | Projected |
Based on 7 years of BLS OEWS data for the Massachusetts metropolitan area, the median welder salary grew 19.4% from $51,845 (2019) to $61,880 (2025). At a 3.99% compound annual growth rate, salaries are projected to reach $66,916 by 2027 — a total increase of $15,071 (29.07%) from 2019.
Note: Historical values (2019–2025) are actual BLS OEWS figures for the Massachusetts metropolitan area, sourced from annual Occupational Employment and Wage Statistics surveys. 2026–2026 figures are current estimates, and 2027 values are projections, calculated using a 3.99% CAGR derived from 7-year BLS historical data. Actual salaries may vary based on employer, experience, certifications, and local market conditions.
Top 5 Highest Paying Cities in Massachusetts
Lowest Paying Cities in Massachusetts
| City | Median Salary |
|---|---|
| Andover | $57,422 |
| Leominster | $57,563 |
| Wellesley | $57,615 |
| Chelmsford | $57,648 |
| Woburn | $57,700 |
Best Value Cities for Welders in Massachusetts
When adjusted for local cost of living, these Massachusetts cities offer the most purchasing power for welders.
| City | Nominal Salary | CoL Index | Adjusted Salary |
|---|---|---|---|
| Boston | $66,314 | 108.266 | $61,251 |
| Worcester | $62,727 | 102.523 | $61,183 |
| Springfield | $58,245 | 96.061 | $60,633 |
| Newton | $65,781 | 108.5 | $60,628 |
| Cambridge | $64,731 | 108.5 | $59,660 |
Adjusted salary = nominal salary × (100 / CoL index). CoL index: 100 = national average. Lower index = lower cost of living.
Salary by Experience Level in Massachusetts
| Experience Level | Estimated Annual |
|---|---|
| Entry Level (0-2 years) | $49,090 |
| Mid Career (3-7 years) | $64,349 |
| Experienced (7+ years) | $85,766 |
Estimates based on BLS percentile data averaged across Massachusetts metro areas. Individual pay varies by employer, certifications, and specialization.
All 57 Cities in Massachusetts
| # | City | Median Salary |
|---|---|---|
| 1 | Boston | $66,314 |
| 2 | Newton | $65,781 |
| 3 | Cambridge | $64,731 |
| 4 | Worcester | $62,727 |
| 5 | Lynn | $62,289 |
| 6 | Somerville | $61,474 |
| 7 | Revere | $61,377 |
| 8 | Brockton | $61,167 |
| 9 | New Bedford | $61,098 |
| 10 | Plymouth | $61,060 |
| 11 | Malden | $60,839 |
| 12 | Haverhill | $60,830 |
| 13 | Lowell | $60,813 |
| 14 | Framingham | $60,786 |
| 15 | Peabody | $60,705 |
| 16 | Weymouth | $60,522 |
| 17 | Chicopee | $60,339 |
| 18 | Randolph | $60,274 |
| 19 | Quincy | $60,167 |
| 20 | Amherst | $60,095 |
| 21 | Chelsea | $60,091 |
| 22 | Medford | $59,926 |
| 23 | Fall River | $59,869 |
| 24 | Marlborough | $59,869 |
| 25 | Watertown | $59,860 |
| 26 | Pittsfield | $59,817 |
| 27 | Fitchburg | $59,813 |
| 28 | Methuen | $59,790 |
| 29 | Taunton | $59,763 |
| 30 | Arlington | $59,742 |
| 31 | Needham | $59,586 |
| 32 | Westfield | $59,558 |
| 33 | Everett | $59,549 |
| 34 | Holyoke | $59,243 |
| 35 | Beverly | $59,144 |
| 36 | Lawrence | $59,143 |
| 37 | Dartmouth | $59,074 |
| 38 | Waltham | $59,014 |
| 39 | Barnstable | $58,951 |
| 40 | Brookline | $58,822 |
| 41 | Billerica | $58,730 |
| 42 | Braintree | $58,533 |
| 43 | Salem | $58,434 |
| 44 | Natick | $58,396 |
| 45 | Springfield | $58,245 |
| 46 | Dracut | $58,090 |
| 47 | Lexington | $58,052 |
| 48 | Stoughton | $58,052 |
| 49 | Northampton | $58,047 |
| 50 | Shrewsbury | $57,978 |
| 51 | Franklin | $57,822 |
| 52 | Attleboro | $57,775 |
| 53 | Woburn | $57,700 |
| 54 | Chelmsford | $57,648 |
| 55 | Wellesley | $57,615 |
| 56 | Leominster | $57,563 |
| 57 | Andover | $57,422 |
More Massachusetts Salary Data
Explore More Welder Salary Data
Frequently Asked Questions
How much do welders make in Massachusetts in 2026?
What is the highest paying city for welders in Massachusetts?
How does Massachusetts welder pay compare to the national average?
What is the entry-level welder salary in Massachusetts?
How many welders are employed in Massachusetts?
Which Massachusetts city offers the best value for welders?
Written by James Mendoza, AWS Certified Welder
Career Analyst
James has over 10 years of experience in welding. He specializes in MIG and TIG welding. He has worked in various manufacturing settings.
Methodology & Data Source
Statewide salary figures on this page are 2026 projections based on the Bureau of Labor Statistics Occupational Employment and Wage Statistics (OEWS) survey, May 2026 release. A 3.99% compound annual growth rate (CAGR), derived from 6-year national BLS wage trends, was applied to each metro area's reported salary to estimate current 2026 welder compensation across Massachusetts. State averages are employment-weighted across 57 metro areas — larger metro areas with more welderscontribute proportionally more to the average, producing figures that better reflect typical compensation. Individual pay varies by city, employer, certifications, and experience.
Data Sources & Methodology
Source: BLS, OEWS, 7-year dataset (–). Per-city data from annual BLS metropolitan area surveys.
2026 figures are projected from 2025 BLS data using a compound annual growth rate (CAGR) of 3.99%, derived from historical BLS wage trends for welders (SOC 51-4121).
Compiled and verified by James Mendoza, AWS Certified Welder, a licensed welder with 10+ years of clinical experience. · View source data at BLS.gov