Welder Salary in Normal, IL: $50,440 (2026)
Quick Answer:A full-time welder in Normal, IL earns a median $50,440/year (≈ $24.25/hour) in nominal terms for 2026 — projected from BLS OEWS 2025 (SOC 51-4121). Once you factor in Normal's price level (3% below national, BEA RPP 97.1), that paycheck buys what $51,946 would nationally. Nominal pay sits 3.0% below the Illinois state average.
Based on BLS state-level estimates · View source
In 2026, the welder salary in Normal, Illinois, is projected to be around $50,440 annually, which falls below the national average of $55,895. The local salary range for welders extends from $35,885 at the lowest 10th percentile to $72,017 at the 90th percentile. These estimates, derived from BLS state-level data and adjusted for regional cost variations, reflect the local economics, particularly the advantages of traveling pipe welders who benefit from tax-advantaged structures and per-diem allowances that can significantly boost their income. Given the demand for skilled trades in Normal, those with specialized qualifications and certifications, such as 6G welding and ASME IX, are more likely to secure higher pay opportunities.
About the Normal Market
Salary estimated from Illinois average ($58,000) adjusted for local cost of living.
Salary Breakdown
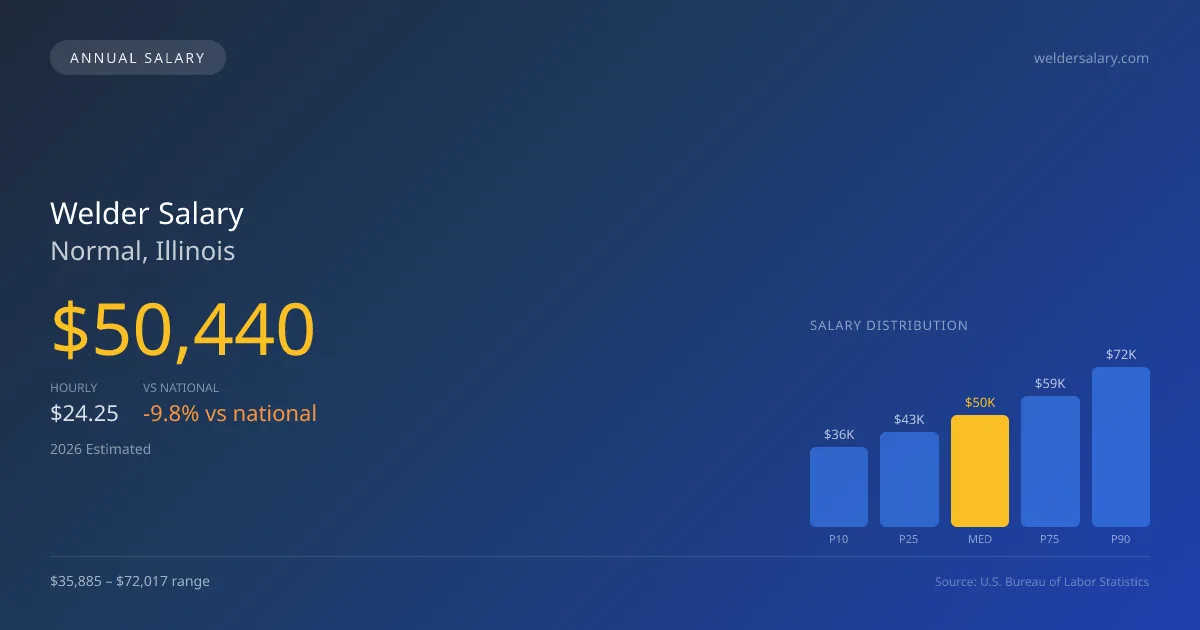
| Percentile | Annual | Hourly |
|---|---|---|
| Entry Level (P10) | $35,885 | $17.25 |
| Lower Range (P25) | $42,826 | $20.59 |
| Median (P50)(typical) | $50,440 | $24.25 |
| Upper Range (P75) | $58,910 | $28.33 |
| Top Earners (P90) | $72,017 | $34.63 |
Median Salary Position
9.76% below the national average
2026 Salary Percentile Distribution in Normal
In Normal, IL, the welder salary spread from the 10th to 90th percentile is $36,132 (2026 est.). At $50,440, the local median is 9.76% below the national median of $55,895.
Salary Calculator
At 40 hours/week in Normal: You'd be in the lower-middle range
How Normal Welder Pay Compares
Normal median: $50,440/year (2026)
| Compared To | Median Salary | Normal Pays |
|---|---|---|
| Illinois Average | $52,000 | -3.00% less |
| National Average | $55,895 | -9.76% less |
Welders in Normal, IL earn a median of $50,440 per year (2026 est.), which is 9.76% lower than the national median of $55,895 and 3.00% below the Illinois state average of $52,000.
Cost-of-Living Adjusted Salary
Normal has a cost of living 2.90% below the national average, meaning your salary goes further here.
Adjusted salary = nominal × (100 / CoL index). CoL index: 100 = national average.
Normal, IL has a cost-of-living index of 97.1 (below the national average of 100). A welder earning $50,440 nominally has purchasing power equivalent to $51,946 in an average-cost city — an effective 2.99% boost.
Compare Purchasing Power
Select a city to see how your salary compares after cost of living
Select a city above to compare purchasing power
2019 BLS Actual
$38,344
2025 BLS Actual
$48,505
2026 Current Est.
$50,440
2019–2027 Growth
+36.8%
Salary Trajectory for Welders in Normal (2019–2027)
2019–2025: actual BLS OEWS data for this metro area. 2026+: CAGR 3.99% projection.
| Year | Annual Salary | Status |
|---|---|---|
| 2019 | $38,344 | Actual |
| 2020 | $39,878 | Actual |
| 2021 | $42,423 | Actual |
| 2022 | $42,901 | Actual |
| 2023 | $44,164 | Actual |
| 2024 | $54,602 | Actual |
| 2025 | $48,505 | Actual |
| 2026(current) | $50,440 | Estimated |
| 2027 | $52,453 | Projected |
Based on 7 years of BLS OEWS data for the Normal metropolitan area, the median welder salary grew 26.5% from $38,344 (2019) to $48,505 (2025). At a 3.99% compound annual growth rate, salaries are projected to reach $52,453 by 2027 — a total increase of $14,109 (36.80%) from 2019.
Note: Historical values (2019–2025) are actual BLS OEWS figures for the Normal metropolitan area, sourced from annual Occupational Employment and Wage Statistics surveys. 2026–2026 figures are current estimates, and 2027 values are projections, calculated using a 3.99% CAGR derived from 7-year BLS historical data. Actual salaries may vary based on employer, experience, certifications, and local market conditions.
Salary by Experience Level
| Experience | Estimated Salary Range |
|---|---|
| 0-2 years (New Graduate) | $35,885 – $42,826 |
| 3-5 years (Mid Career) | $42,826 – $50,440 |
| 5+ years (Experienced) | $50,440 – $58,910 |
| 10+ years (Top Earner) | $58,910 – $72,017 |
WLD salary ranges estimated from BLS percentile data. Individual welder compensation varies by employer, certifications, and specialization.
Welder Job Market in Normal
Currently, eight welders are employed in Normal, a small workforce indicative of a niche market that offers unique challenges and rewards. The cost of living index stands at 97.1, suggesting that while salaries may lag behind national averages, purchasing power remains viable for welders in the area. Employers specializing in structural steel, oil and gas pipeline projects, and petrochemical turnaround crews likely offer the most competitive wages. The income span among welders can be a result of various factors, including experience level, specialty certifications, and the nature of the work—traveling welders often receive additional compensation. For welders in Normal, enhancing skills through certifications and seeking work that includes per-diem can maximize earnings potential effectively.
More salary data for Normal, IL:
Frequently Asked Questions
How much do welders make in Normal, IL in 2026?
Is Normal, IL a good place to work as a welder?
Can welders make $100K in Normal?
What is the cost-of-living adjusted welder salary in Normal?
How much does a welder make per hour in Normal?
Related Pages
Compare Salaries
Career Resources
Nearby Cities in Illinois
Written by James Mendoza, AWS Certified Welder
Career Analyst
James has over 10 years of experience in welding. He specializes in MIG and TIG welding. He has worked in various manufacturing settings.
Methodology & Data Source
Salary figures on this page are 2026 projections based on the Bureau of Labor Statistics Occupational Employment and Wage Statistics (OEWS) survey, May 2026 release. The BLS reported a median annual salary of $48,505 for weldersin the Normal metropolitan area. A 3.99% compound annual growth rate (CAGR), calculated from 6-year national BLS wage trends, was applied to project current 2026 compensation. Percentile ranges (P10–P90) represent the full salary distribution across experience levels and practice settings in this market.
Data Sources & Methodology
Salary data for Normal is estimated from official BLS state-level occupational wage data (2025), adjusted for regional cost-of-living differences using BEA RPP (Regional Price Parities).
2026 figures are projected from 2025 BLS data using a compound annual growth rate (CAGR) of 3.99%, derived from historical BLS wage trends for welders (SOC 51-4121).
Compiled and verified by James Mendoza, AWS Certified Welder, a licensed welder with 10+ years of clinical experience. · View source data at BLS.gov