Welder Salary in Richmond, CA: $56,455 (2026)
Quick Answer:A full-time welder in Richmond, CA earns a median $56,455/year (≈ $27.14/hour) in nominal terms for 2026 — projected from BLS OEWS 2025 (SOC 51-4121). Once you factor in Richmond's price level (13% above national, BEA RPP 113.1), that paycheck buys what $49,916 would nationally. Nominal pay sits 1.9% above the California state average.
Based on BLS state-level estimates · View source
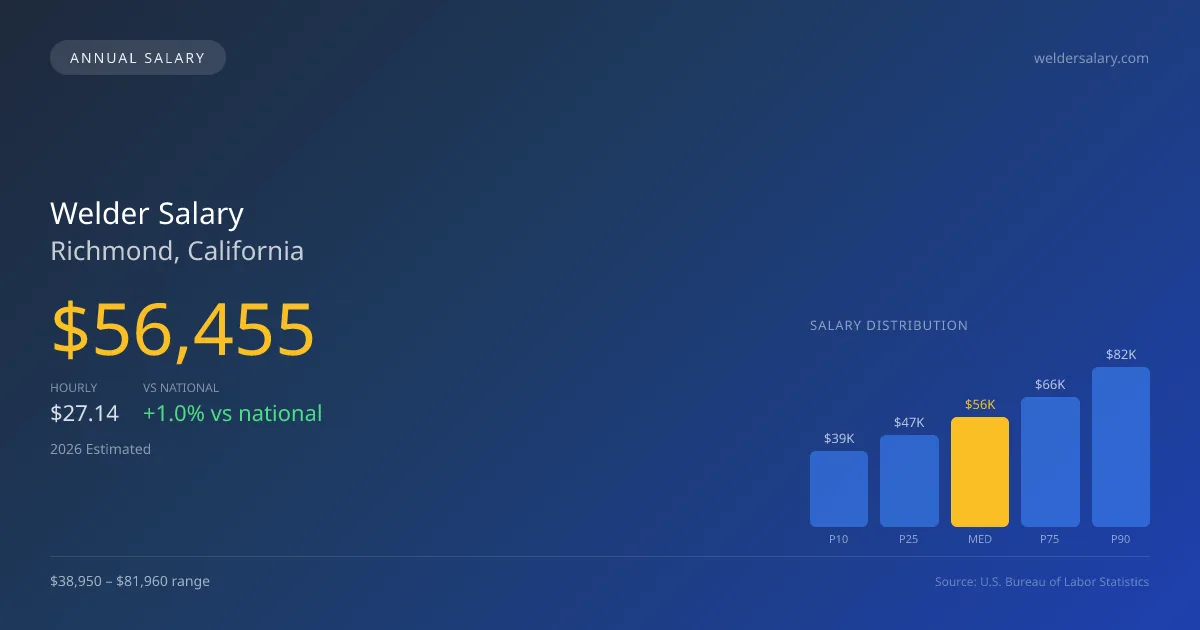
Welders in Richmond, California, can expect a median annual salary of $56,455 in 2026, slightly above the national median of $55,895. The salary range in this region spans from $38,950 at the lowest decile to $81,960 at the highest, reflecting the diverse array of welding specialties available. Richmond's job market sees a significant concentration of pipe welders, particularly those with advanced certifications like 6G, who generally command higher salaries than their structural and production welding counterparts. This localized data, derived from BLS state-level estimates and adjusted for regional economic conditions, illustrates that Richmond's welding sector is driven by specialty skills and certification levels.
About the Richmond Market
Salary estimated from California average ($62,000) adjusted for local cost of living.
Salary Breakdown
| Percentile | Annual | Hourly |
|---|---|---|
| Entry Level (P10) | $38,950 | $18.73 |
| Lower Range (P25) | $47,311 | $22.74 |
| Median (P50)(typical) | $56,455 | $27.14 |
| Upper Range (P75) | $66,437 | $31.95 |
| Top Earners (P90) | $81,960 | $39.40 |
Median Salary Position
1.00% above the national average
2026 Salary Percentile Distribution in Richmond
In Richmond, CA, the welder salary spread from the 10th to 90th percentile is $43,010 (2026 est.). At $56,455, the local median is 1% above the national median of $55,895.
Salary Calculator
At 40 hours/week in Richmond: You'd be in the lower-middle range
How Richmond Welder Pay Compares
Richmond median: $56,455/year (2026)
| Compared To | Median Salary | Richmond Pays |
|---|---|---|
| California Average | $55,402 | +1.90% more |
| National Average | $55,895 | +1.00% more |
Welders in Richmond, CA earn a median of $56,455 per year (2026 est.), which is 1.00% higher than the national median of $55,895 and 1.90% above the California state average of $55,402.
Cost-of-Living Adjusted Salary
Richmond has a cost of living 13.10% above the national average.
Adjusted salary = nominal × (100 / CoL index). CoL index: 100 = national average.
Richmond, CA has a cost-of-living index of 113.1 (above the national average of 100). While the nominal salary of $56,455 is competitive, the higher cost of living reduces purchasing power to an effective $49,916 — a 11.58% reduction.
Compare Purchasing Power
Select a city to see how your salary compares after cost of living
Select a city above to compare purchasing power
2019 BLS Actual
$42,916
2025 BLS Actual
$54,289
2026 Current Est.
$56,455
2019–2027 Growth
+36.8%
Salary Trajectory for Welders in Richmond (2019–2027)
2019–2025: actual BLS OEWS data for this metro area. 2026+: CAGR 3.99% projection.
| Year | Annual Salary | Status |
|---|---|---|
| 2019 | $42,916 | Actual |
| 2020 | $44,633 | Actual |
| 2021 | $47,481 | Actual |
| 2022 | $48,017 | Actual |
| 2023 | $49,431 | Actual |
| 2024 | $71,449 | Actual |
| 2025 | $54,289 | Actual |
| 2026(current) | $56,455 | Estimated |
| 2027 | $58,708 | Projected |
Based on 7 years of BLS OEWS data for the Richmond metropolitan area, the median welder salary grew 26.5% from $42,916 (2019) to $54,289 (2025). At a 3.99% compound annual growth rate, salaries are projected to reach $58,708 by 2027 — a total increase of $15,792 (36.80%) from 2019.
Note: Historical values (2019–2025) are actual BLS OEWS figures for the Richmond metropolitan area, sourced from annual Occupational Employment and Wage Statistics surveys. 2026–2026 figures are current estimates, and 2027 values are projections, calculated using a 3.99% CAGR derived from 7-year BLS historical data. Actual salaries may vary based on employer, experience, certifications, and local market conditions.
Salary by Experience Level
| Experience | Estimated Salary Range |
|---|---|
| 0-2 years (New Graduate) | $38,950 – $47,311 |
| 3-5 years (Mid Career) | $47,311 – $56,455 |
| 5+ years (Experienced) | $56,455 – $66,437 |
| 10+ years (Top Earner) | $66,437 – $81,960 |
WLD salary ranges estimated from BLS percentile data. Individual welder compensation varies by employer, certifications, and specialization.
Welder Job Market in Richmond
A total of 25 welders are currently employed in Richmond, CA, reflecting a niche market where demand for skilled welding professionals remains robust, especially in sectors like oil and gas pipeline welding or aerospace and defense. The local cost of living index sits at 113.1, indicating that while salaries are competitive, the higher purchasing power is necessary to accommodate living expenses. Factors such as employer type significantly influence welder pay; those engaged in structural steel fabrication, oil and gas projects, or working with specialty materials can achieve greater compensation. Variations in income arise from skills—6G pipe welders and those engaged in underwater or nuclear welding often earn premiums, especially in traveling roles that can include substantial per-diem rates. For welders aiming to maximize earnings in Richmond, pursuing further certifications, seeking out roles in high-demand industries, and considering traveling positions can significantly enhance financial outcomes.
More salary data for Richmond, CA:
Frequently Asked Questions
How much do welders make in Richmond, CA in 2026?
Is Richmond, CA a good place to work as a welder?
Can welders make $100K in Richmond?
What is the cost-of-living adjusted welder salary in Richmond?
How much does a welder make per hour in Richmond?
Related Pages
Compare Salaries
Career Resources
Nearby Cities in California
Written by James Mendoza, AWS Certified Welder
Career Analyst
James has over 10 years of experience in welding. He specializes in MIG and TIG welding. He has worked in various manufacturing settings.
Methodology & Data Source
Salary figures on this page are 2026 projections based on the Bureau of Labor Statistics Occupational Employment and Wage Statistics (OEWS) survey, May 2026 release. The BLS reported a median annual salary of $54,289 for weldersin the Richmond metropolitan area. A 3.99% compound annual growth rate (CAGR), calculated from 6-year national BLS wage trends, was applied to project current 2026 compensation. Percentile ranges (P10–P90) represent the full salary distribution across experience levels and practice settings in this market.
Data Sources & Methodology
Salary data for Richmond is estimated from official BLS state-level occupational wage data (2025), adjusted for regional cost-of-living differences using BEA RPP (Regional Price Parities).
2026 figures are projected from 2025 BLS data using a compound annual growth rate (CAGR) of 3.99%, derived from historical BLS wage trends for welders (SOC 51-4121).
Compiled and verified by James Mendoza, AWS Certified Welder, a licensed welder with 10+ years of clinical experience. · View source data at BLS.gov