Welder Salary in Napa, CA: $65,399 (2026)
Quick Answer:A full-time welder in Napa, CA earns a median $65,399/year (≈ $31.45/hour) in nominal terms for 2026 — projected from BLS OEWS 2025 (SOC 51-4121). Once you factor in Napa's price level (13% above national, BEA RPP 112.6), that paycheck buys what $58,105 would nationally. Nominal pay sits 18.0% above the California state average.
Official BLS data · View source
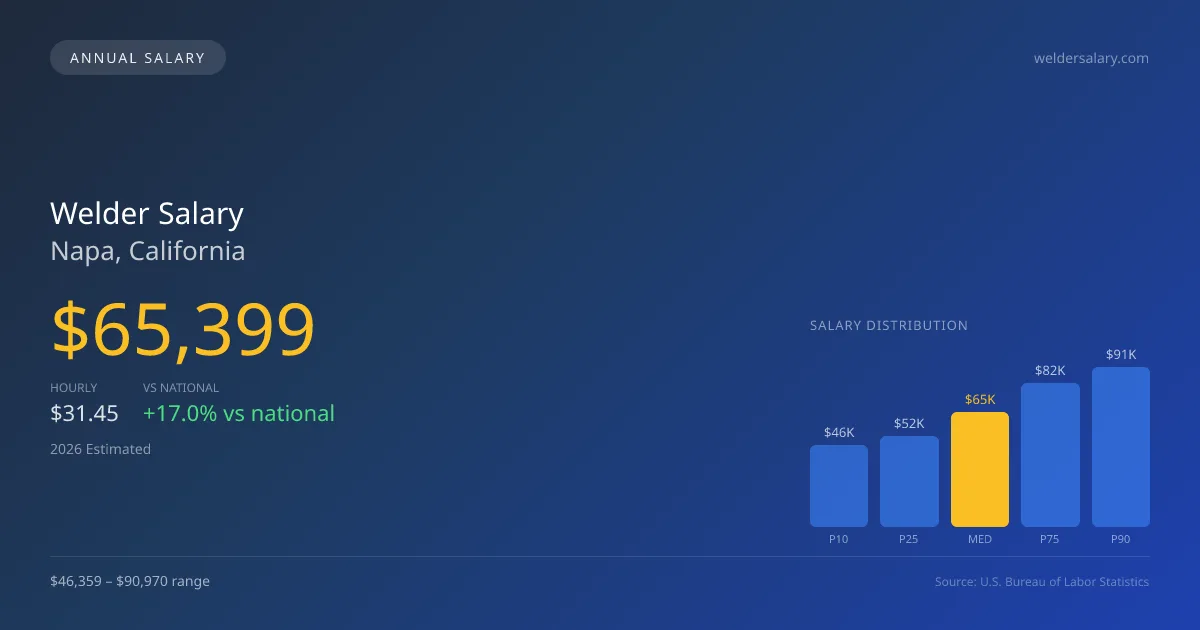
In Napa, CA, the projected median annual salary for welders in 2026 is $65,399, surpassing the national average of $55,895 by a notable 17.00%. Welders in this region can expect a salary range between $46,359 at the 10th percentile and $90,970 at the 90th percentile. This data is derived from official BLS OEWS surveys, reflecting the local job market's demand and the skills available. Factors like specialization and certification significantly influence income levels, creating opportunities for welders to enhance their earning potential, particularly for those pursuing roles such as pipe welders or rig welder ownership leading to higher hourly rates.
Salary Breakdown
| Percentile | Annual | Hourly |
|---|---|---|
| Entry Level (P10) | $46,359 | $22.30 |
| Lower Range (P25) | $52,016 | $25.01 |
| Median (P50)(typical) | $65,399 | $31.45 |
| Upper Range (P75) | $82,079 | $39.46 |
| Top Earners (P90) | $90,970 | $43.74 |
Median Salary Position
17.00% above the national average
2026 Salary Percentile Distribution in Napa
In Napa, CA, the welder salary spread from the 10th to 90th percentile is $44,611 (2026 est.). At $65,399, the local median is 17% above the national median of $55,895.
Salary Calculator
At 40 hours/week in Napa: You'd be in the lower-middle range
How Napa Welder Pay Compares
Napa median: $65,399/year (2026)
| Compared To | Median Salary | Napa Pays |
|---|---|---|
| California Average | $55,423 | +18.00% more |
| National Average | $55,895 | +17.00% more |
Welders in Napa, CA earn a median of $65,399 per year (2026 est.), which is 17.00% higher than the national median of $55,895 and 18.00% above the California state average of $55,423.
Cost-of-Living Adjusted Salary
Napa has a cost of living 12.55% above the national average.
Adjusted salary = nominal × (100 / CoL index). CoL index: 100 = national average.
Napa, CA has a cost-of-living index of 112.554 (above the national average of 100). While the nominal salary of $65,399 is competitive, the higher cost of living reduces purchasing power to an effective $58,105 — a 11.15% reduction.
Compare Purchasing Power
Select a city to see how your salary compares after cost of living
Select a city above to compare purchasing power
2019 BLS Actual
$50,230
2025 BLS Actual
$62,890
2026 Current Est.
$65,399
2019–2027 Growth
+35.4%
Salary Trajectory for Welders in Napa (2019–2027)
2019–2025: actual BLS OEWS data for this metro area. 2026+: CAGR 3.99% projection.
| Year | Annual Salary | Status |
|---|---|---|
| 2019 | $50,230 | Actual |
| 2020 | $46,500 | Actual |
| 2021 | $53,140 | Actual |
| 2022 | $57,330 | Actual |
| 2023 | $58,480 | Actual |
| 2024 | $58,920 | Actual |
| 2025 | $62,890 | Actual |
| 2026(current) | $65,399 | Estimated |
| 2027 | $68,009 | Projected |
Based on 7 years of BLS OEWS data for the Napa metropolitan area, the median welder salary grew 25.2% from $50,230 (2019) to $62,890 (2025). At a 3.99% compound annual growth rate, salaries are projected to reach $68,009 by 2027 — a total increase of $17,779 (35.40%) from 2019.
Note: Historical values (2019–2025) are actual BLS OEWS figures for the Napa metropolitan area, sourced from annual Occupational Employment and Wage Statistics surveys. 2026–2026 figures are current estimates, and 2027 values are projections, calculated using a 3.99% CAGR derived from 7-year BLS historical data. Actual salaries may vary based on employer, experience, certifications, and local market conditions.
Salary by Experience Level
| Experience | Estimated Salary Range |
|---|---|
| 0-2 years (New Graduate) | $46,359 – $52,016 |
| 3-5 years (Mid Career) | $52,016 – $65,399 |
| 5+ years (Experienced) | $65,399 – $82,079 |
| 10+ years (Top Earner) | $82,079 – $90,970 |
WLD salary ranges estimated from BLS percentile data. Individual welder compensation varies by employer, certifications, and specialization.
Welder Job Market in Napa
With 70 welders currently employed in Napa, job availability remains steady, though the cost of living index in the area sits at 112.554, suggesting that expenses are higher than the national average. This expense can affect take-home purchasing power, making it critical for welders to consider employers that offer competitive pay. For instance, structural steel fabrication shops and mobile welders can provide intriguing pay prospects, particularly if one possesses high-demand certifications like 6G or expertise in specialized areas such as nuclear or aerospace welding. The income disparity among welders in Napa arises from various factors, including the level of training, type of welding work (like underwater versus production), and geographical mobility for higher-paying traveling contracts. Strategies like investing in certifications or exploring rig ownership could maximize one’s earnings in this robust Napa market.
More salary data for Napa, CA:
Frequently Asked Questions
How much do welders make in Napa, CA in 2026?
Is Napa, CA a good place to work as a welder?
Can welders make $100K in Napa?
What is the cost-of-living adjusted welder salary in Napa?
How much does a welder make per hour in Napa?
Related Pages
Compare Salaries
Career Resources
Nearby Cities in California
Written by James Mendoza, AWS Certified Welder
Career Analyst
James has over 10 years of experience in welding. He specializes in MIG and TIG welding. He has worked in various manufacturing settings.
Methodology & Data Source
Salary figures on this page are 2026 projections based on the Bureau of Labor Statistics Occupational Employment and Wage Statistics (OEWS) survey, May 2026 release. The BLS reported a median annual salary of $62,890 for weldersin the Napa metropolitan area. A 3.99% compound annual growth rate (CAGR), calculated from 6-year national BLS wage trends, was applied to project current 2026 compensation. Percentile ranges (P10–P90) represent the full salary distribution across experience levels and practice settings in this market.
Data Sources & Methodology
Source: BLS, OEWS, 7-year dataset (–). Per-city data from annual BLS metropolitan area surveys.
2026 figures are projected from 2025 BLS data using a compound annual growth rate (CAGR) of 3.99%, derived from historical BLS wage trends for welders (SOC 51-4121).
Compiled and verified by James Mendoza, AWS Certified Welder, a licensed welder with 10+ years of clinical experience. · View source data at BLS.gov